
The 3D mapper is more important than the VT isthmus… ok ok, let me explain

Question:

You've mapped the LV during sustained, re-entrant VT. After mapping, there's a spot where red meets purple or "early meets late". Someone says "that's got to be the isthmus".


Is that the isthmus, or just how the window of interest was set?

(Click to zoom on image)

Answer:

Not necessarily. Red meeting purple marks the earliest & latest electrograms inside the window of interest you set, relative to your reference. Even a correct WOI might not show the isthmus as early meets late.

  • If your window is -50%/+50% and your reference sits in the middle of the QRS, red & purple are more likely to land in the isthmus.


  • Set the window another way and “Early meets Late” can land somewhere else entirely, like the outer loop.


  • On a re-entrant map the colours themselves don’t matter. What the colours represent does, & so does the overall picture.


The colour bar first

Before looking for red, look at the colour bar. On a re-entrant map it’s the first thing that tells you whether a circuit can even be on the screen.

  1. Does the “mapped” cycle length match the VT cycle length?
  2. If yes, start looking for your red, then follow the colours of the rainbow to purple.
  3. If no, you haven’t mapped the entire VT circuit yet.


The colour bar shows how much cycle length you’ve collected so far. On this particular company’s system the colour bar is a circle, but the numbers mean the same thing.

Colour-bar check on a re-entrant VT activation map. The TCL is 485ms; the circular colour bar shows about 483ms collected.

In the example above:

  • Tachycardia cycle length (TCL) = 485ms.
  • The colour bar reads -371 & +112. That’s 371ms collected before the reference & 112ms after it.
  • Add those up: 483ms collected.

483ms more or less matches 485ms…(we don’t get too pedantic in VT mapping, because much of the VT circuit is often hidden intramurally). Near enough is good enough. So now we know its plausible the entire re-entrant circuit is displayed on the map somewhere, & now it’s time to go and look for it.


If that number was only 240ms, you haven’t collected much of the TCL. You might have part of the circuit, and if you’re lucky you might have the isthmus, but you haven’t mapped one full rotation…so you should keep mapping.


If you’ve mapped the whole LV and still only have 240ms, this VT may be in the right ventricle. Or part of the circuit may be intramural or epicardial, and you’ve only mapped the LV endocardium. VT circuits are often very 3D, which is why you often don’t get the full TCL on an endocardial map.


Colour bars matter a lot for activation maps of re-entrant arrhythmias. They’re not that important for focal ones.


A figure-of-eight VT showing every colour of the rainbow (tilt your head 90 degrees and it’s an eight) is the gold standard. Even after years & years of mapping VT, a complete ventricular activation map is very difficult to get.


The window of interest

The WOI is simply the electrograms you want to include on your map. Any EGM inside it gets a timing relative to your reference, and that timing is assigned a colour onto the map.


The reference should be in the same chamber, or at least the same half of the heart, as the one you’re mapping. For VT that’s a ventricular EGM or the QRS. Above all, it has to be consistent beat to beat. Probably nine times out of ten or more I’ll choose a QRS complex. Avoid a lead with two peaks of similar amplitude (V1 can do this), because the system can flick between them creating mapping instability. Minimum amplitude on a single S wave can be cleaner.


One rotation of the circuit takes one TCL. In our example that’s 485ms to go through the isthmus, out the exit, around the outer loop, into the entrance and back into the isthmus. So most of the time I want the window to include the full TCL.


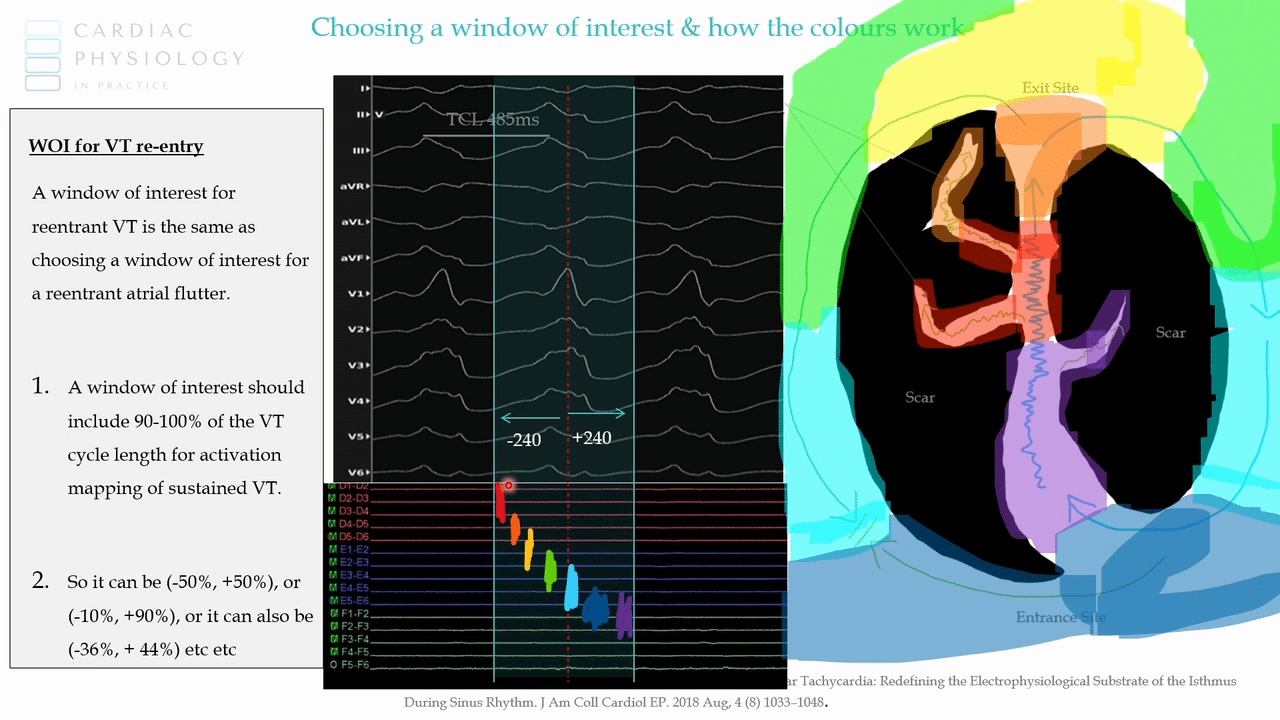
  • The slide version: a window of interest for re-entrant VT should include 100% of the TCL, or just a little bit less.


  • I just do -50%/+50% because the maths is easy. For a 480-ish ms TCL, that’s -240/+240.


  • One of my mentors in 3D mapping used to always go -100ms and then plus whatever was remaining. Easy maths again: take 100ms off the cycle length and put the rest to the right.


  • You could do -10%/+90%, or -385/+100. That’s fine. So long as the numbers add up to close to the TCL.


In every one of those, the window is the same size. You’ve only moved it relative to the reference.

Lecture slide: choosing a window of interest for re-entrant VT. A window should include 90 to 100% of the VT cycle length.

For an experienced mapper, it doesn’t matter how you set the window. The information will be there on your map. The colours will be different, but the colours don’t matter for a re-entrant circuit. I’ll say it again…the colours don’t matter for a re-entrant circuit.


Why red sits next to purple

Take the -240/+240 window, with the reference in the middle of the QRS. Then walk the catheter around the circuit. This is more easily explained with the diagram below. Walking the catheter across the whole circuit will look like this:

  • Isthmus. The EGM is mid-diastolic, between the QRS complexes. It may also be fractionated & low amplitude, but ignore that for a second & just look at the timing. Mid-diastolic sits at the very start of the window. It’s a negative number, around -240, so it’s coloured Red.


  • A little closer to QRS onset. Early relative to the reference, but not as early as the mid-diastolic potential. Orange.


  • Exit. An EGM around QRS onset often correlates with an exit site. It’s close to the reference, so it sits in the middle of the rainbow, around yellow.


  • Inside the QRS, still early relative to the reference. Green.


  • Late systolic, well after the reference. Blue.


  • Back into the isthmus. Roughly mid-diastolic again, but now it falls after the reference & is the latest EGM in the window. Purple.


That’s why re-entrant maps have red & purple next to each other. For all intents & purposes, that last purple EGM & the first red EGM are nearly the same timing. The window exaggerates the difference by calling one last & the other first.


Because the isthmus conducts slowly, EGMs of that timing are clustered in a small area. So red is often a much smaller patch than yellow. Follow the colours of the rainbow & you have the circuit, because -240 + 240 = 480ms. That’s the full TCL, give or take about 5ms.

The only gold-standard way to confirm this is the re-entrant circuit is to entrain from here & confirm the post-pacing interval is zero milliseconds with entrainment. In reality, often what we do is just ablate here & see if it terminates.


Move the window

This is why colours don’t matter.

Same circuit, same reference, but now the window is -10ms/+470ms. Still 480ms. Still a legitimate window. All we’ve done is slide it.

The mid-diastolic isthmus potential that was red (earliest) in the first window is now in the middle of this window. So it lines up with green.

The same circuit at -240/+240 (left) and -10/+470 (right). The colours move with the window; the circuit stays put.

“What happened to the map?”

The system always tries to use the full spectrum of colours. It stretches red to purple across the earliest & latest points you’ve collected so far (the same “so far” problem as focal mapping).

Build the -10/+470 map point by point:

  • The first isthmus point is around +230ms in this window. It’s the only point, so it’s the earliest collected so far, & it gets coloured red.
  • The next point is orange. The exit is yellow.
  • Then you map the outer loop. That EGM falls past +470, which is outside this window, but it falls inside the window belonging to the next beat’s reference, just before 0. So it’s the earliest EGM in the window. It should be red, not the mid-diastolic point that was only red because it was the earliest collected so far.
  • The system recalibrates every colour against the new red. The isthmus that was red drops down the rainbow, & everything else shifts with it.
  • Find an even earlier point near the entrance & it all recolours again.


Part way through a map, suddenly all the colours change at once & someone asks “What happened to the map?” The system has found a new earliest point & recalibrated everything against it.

Building the -10/+470 map. The first isthmus point is red until an earlier outer-loop point appears, then the whole map recolours.

The isthmus on the second map

The finished -10/+470 map looks very different from the first one.

  • On the first map, red met purple in the isthmus. This is why physicians look for red & purple colliding & decide “that’s got to be the isthmus”.
  • On this map, red & purple collide at the outer loop. Ablating there would do absolutely bugger all.
  • Green & yellow are the significant colours here, because they label the isthmus.

Same circuit at two windows. Left: −240/+240, red meets purple in the isthmus. Right: −10/+470, the isthmus is green and yellow.


You’d still read the circuit the same way: red, orange, yellow, green, light blue, dark blue, purple. You’ve found the same VT circuit as before. The colours are just in different spots.


So the job is:

  1. Follow the rainbow to get the overall picture of the circuit.
  2. Work out which colours are mid-diastolic in YOUR window.
  3. Go & look at the individual EGMs there, and check whether they are fractionated, low voltage and mid-diastolic.


The colour isn’t that important. EGMs are always important.

The same principles apply to atrial flutter.

If you’re not mapping during VT, it’s generally called a substrate map, & often voltage is collected too. A timing map in sinus or during pacing can show isochronal crowding, which correlates with VT isthmus sites but doesn’t actually identify the isthmus. Mapping during VT is different: you treat it like flutter & you’re identifying the isthmus.


My two cents:

  • Measure the VT cycle length, then check the colour bar. If it roughly matches (485ms vs 483ms collected), the whole circuit is plausibly on the map. If it’s well short, you haven’t mapped one full rotation yet.


  • Endocardial LV maps often won’t reach the full TCL, because the circuit can be intramural or epicardial (or in the RV).


  • Set a window of about 90–100% of the TCL. -50%/+50% is the easiest maths. Other splits are fine, because the window stays the same size & only moves relative to the reference.


  • Colours are timings inside your window, stretched across the earliest & latest points collected so far. That’s why the map suddenly recolours when a new earliest point turns up.


  • Red meeting purple is early meets late in your window, not proof of the isthmus. With -50%/+50% & a reference in the middle of the QRS it’s more likely to be the isthmus. With -10/+470 the isthmus is green & yellow.


  • Follow the rainbow for the picture, then find which colours are mid-diastolic in your window & go read those EGMs. Same goes for flutter.


Thanks for tuning in :)

Cheers

Mitch & CPiP Team

Interpreting re-entrant VT activation maps is taught in more depth in the Mapping in 3D program of EP in Practice. https://cardiacphysinpractice.com/ep-in-practice/

Leave a Reply

Subscribe to stay informed

Get the latest updates and event details, and be notified when new courses launch.